Table of Contents
In this post, we look at how we can setup our own kibana plugin.
Note: We are using Kibana 7.x
Quick Background info on Kibana Plugins
According to Elastic:
Kibana is an open source analytics and visualization platform designed to work with Elasticsearch. You use Kibana to search, view, and interact with data stored in Elasticsearch indices. You can easily perform advanced data analysis and visualize your data in a variety of charts, tables, and maps.
Kibana makes it easy to understand large volumes of data. Its simple, browser-based interface enables you to quickly create and share dynamic dashboards that display changes to Elasticsearch queries in real time.
As for what Kibana is technical wise, it’s basically an application made up of a bunch of plugins.
Setting up Kibana and our Plugin (If you haven’t already done so)
Basically This will setup your kibana dev folders and generate your plugin, called test_plugin:
git clone https://github.com/elastic/kibana.git
nvm use
yarn kbn bootstrap
node scripts/generate_plugin.js test_plugin
Note: we run nvm use to automatically switch to the node version that kibana requires
Then we run the Kibana Server and our test plugin will be loaded (run the yarn command at project level, not at the plugin folder):
yarn debug
or
yarn start
It’s important to remember that the version of kibana running must be the same as the elasticsearch version running.
And the generated template plugin should look like this (at least for me, 20th September 2019):
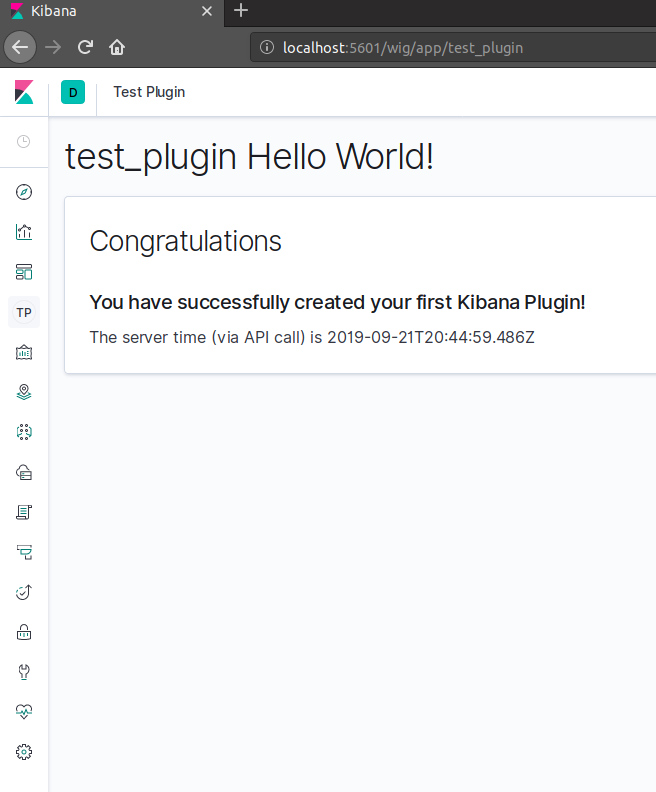
Now, whenever you make changes to your plugin the server will automatically reload.
Bonus: see this tutorial on how to connect your plugin to your ElastiSearch host - this tutorial also contains source code from this project
Regards,
John