Table of Contents
In this post we look at how we can connect our Kibana plugin to our Elasticsearch cluster and query it. For example, in your plugin - you might want to get a number of specific logs within the last 5 minutes.
Source code for tutorial, linked at bottom.
What you need to have
Ideally if you are reading this post, it’s because you already have the following things listed below:
- Kibana Development Environment: Clone Kibana Repo and setup kibana for development. See Kibana’s Guide for setting this up (If you have not done so already). Note: We are using Kibana 7.x
- A Custom Kibana plugin: We won’t look at how to create a kibana plugin in this post, but you can create one using this quick tutorial on setting one up
- Elasticsearch: You need to have Elasticsearch running and also have an index and data in it. Note: We are using elasticsearch 7.6.2
- Node: You need node installed. You need a particular version of Node to run kibana. I suggest you use
nvmto manage and use different versions of node
Understanding how our plugin works (important if you don’t know already)
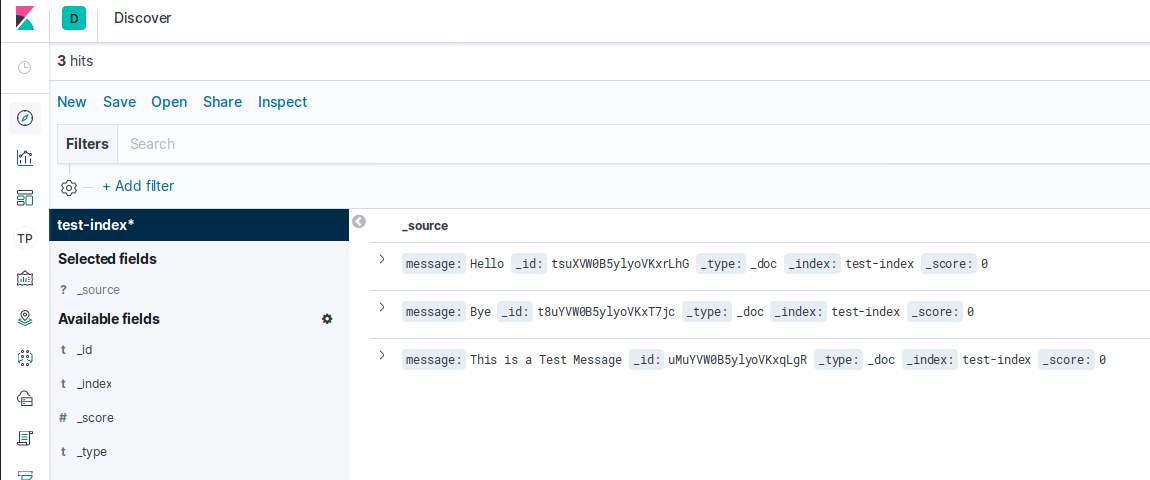
This is the sample data I’m using anf will be pulling into the kibana plugin (There is no time stamp, each document just has one field called “message”).
A Kibana plugin is made up of two parts, The public side, and the server side (It uses React and Angular). The public code runs on the client side, whilst the server side as you may have guessed - runs on the Kibana Server. You might ask, Why? There are many advantages, but one of them is that if you try to query elasticsearch directly from your browser, you will end up with some CORS issues.
Kibana Plugin generated folder structure:
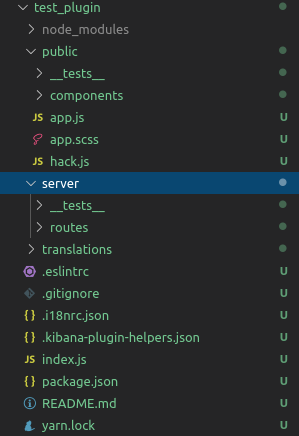
If you generated your kibana plugin using the kibana plugin generator, you would get some server code already:
// folder: server/routes/example.js

export default function (server) {

  server.route({
    path: '/api/test_plugin/example',
    method: 'GET',
    handler() {
      return { time: (new Date()).toISOString() };
    }
  });

}
The above code will generate the current time in ISO format. When the public code runs on the browser, it will run a REST call to the server side of the plugin and receive the current time in ISO format.
// folder: public/components/main.js
...
  componentDidMount() {
    const { httpClient } = this.props;
    httpClient.get('../api/test_plugin/example').then((resp) => {
      this.setState({ time: resp.data.time });
    });
  }
...
I won’t go into detail about the other parts of the code (hence the elipses), but the above code is basically what is responsible for making a call to the server side of the plugin to get the current date time. The variable “httpClient” is a prop that is passed from the public/app.js file.
Actually connecting to Elasticsearch and pulling data from it
Ok so, all we really need to do is add some code to query Elasticsearch on the server side of our plugin.
We can use the Elasticsearch JS Client to query elasticsearch on the server side of our plugin, but I would recommend against this because there is a better solution… And that is to use the elasticsearch kibana plugin, this actually allows you to query Elasticsearch from the client side and server side.
For this tutorial we will use the server side elasticsearch plugin. The two main advantages of using this approach is:
- You don’t have to know the address of the elasticsearch node. Whereas the Elasticsearch JS library requires you to supply this in your server code
- Any Kibana related authentication is also applied when using the elasticsearch plugin for your app. That means that you can use Kibana’s existing authentication system instead of making your own
First, lets update the server code function:
// folder: server/routes/example.js
export default function (server) {

  const { callWithRequest } = server.plugins.elasticsearch.getCluster('data');

  server.route({
    path: '/api/test_plugin/example',
    method: 'GET',
    handler: async function (req, res) {
      let resp = {}
      try {
        resp = await callWithRequest(req, 'search', {
          index: 'test-index',
          size: 10,
          body: {
            query: {
              match: {
                message: "Hello"
              }
            }
          }
        })
      } catch (errResp) {
        resp = errResp
      }
      return { body: resp }
    }
  });

}
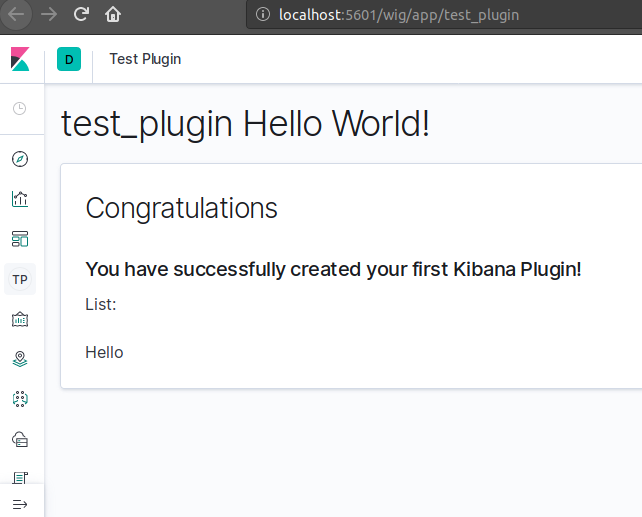
const { callWithRequest } = server.plugins.elasticsearch.getCluster('data');is what we need to talk to Kibana’s elasticsearch plugin.- We make simple query that simple looks for documents with a message field containg the word “Hello” (Based on out test data, we should only get one result)
We then update our api function on the public side (note, we can probably tidy this up a bit instead of “resp.data.body.hits.hits”, but for the sake of simplicity, I’ll leave it as it is)
// folder: public/components/main.js
...
  componentDidMount() {
    const { httpClient } = this.props;
    httpClient.get('../api/test_plugin/example').then((resp) => {
      console.log(resp.data.body.hits.hits);
      this.setState({ hits: resp.data.body.hits.hits });
    });
  }
...
Rendering the Data
now that the result of our elasticsearch query will be stored under this.state.hits (ReactJS) I will then create a simple function to render the outputs based on that:
// folder: public/components/main.js
...
  render_list() {
    let hits = this.state.hits;
    let output = [];

    if (!hits) {
      return <div>No List</div>
    }

    for (let i = 0; i < hits.length; i++) {
      output.push(
        <div key={i}>{`${hits[i]['_source']['message']}`}</div>
      );
    }
    return output;
  }
...
And the result is…
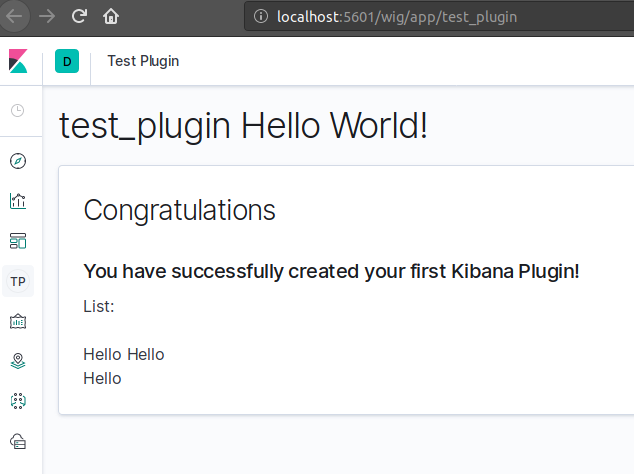
I then, added another document to elasticsearch:
{
  "message": "Hello Hello"
}
We should now see 2 documents that match our query for our plugin:
Conclusion
And that’s how I did it. I hope this helps! Feel free to leave a comment.
John