Table of Contents
Elastic APM is an application performance monitoring system built on the Elastic Stack. It allows you to monitor software services and applications in real time, collecting detailed performance information on response time for incoming requests, database queries, calls to caches, external HTTP requests, etc. This makes it easier to pinpoint and fix performance problems quickly. Elastic APM also automatically collects unhandled errors and exceptions. Errors are grouped based primarily on the stacktrace, so you can identify new errors as they appear and keep an eye on how many times specific errors happen. ~ Elastic APM
In this post we will look at how we can add our (existing) Python Script, to Elastic’s APM performance monitoring tool. APM is a very powerful (and free) tool by Elastic and gives us very useful insight by showing the “Events” The occur in our program.
If you’re unfamiliar with Elastic’s APM concept, I strongly advise to read Elastic’s APM Overview before proceeding.
Install APM Server (Using APT)
Pre-requisites:
- Elasticsearch
- Kibana
For this post, we will use APT (e.g. used in Debian and Ubuntu OS) to install APM-Server, but there are other methods if you don’t want to use APT. See Elastic’s guide for more details on installing APM-server, as well as installing Kibana and Elasticsearch.
Here’s a run down of the CLI commands:
- Download and install the Public Signing Key
- May need to install apt-transport-https package on Debian
- Save repo definition
- install apm-server
- configure apm-server to automatically start on boot
wget -qO - https://artifacts.elastic.co/GPG-KEY-elasticsearch | sudo apt-key add -
sudo apt-get install apt-transport-https
echo "deb https://artifacts.elastic.co/packages/7.x/apt stable main" | sudo tee -a /etc/apt/sources.list.d/elastic-7.x.list
sudo apt-get update && sudo apt-get install apm-server
sudo update-rc.d apm-server defaults 95 10
Configure APM-Server
Before we start APM-server, we need to configure it. More details on Elastic’s docs
Config file location: /etc/apm-server/apm-server.yml
Basic Config:
apm-server:
  host: localhost:8200

output.elasticsearch:
  hosts: ["__Your_Elasticsearch_Address__:9200"]
  username: "your_elasticsearch_username" # If you didn't setup authentication for your Elasticsearch Instance,
  password: "your_elasticsearch_password" # you can leave these 2 fields blank
Start APM-server:
sudo systemctl start apm-server
Create Python Agent out of our Python Code
Normally, when I write my python code, I like to an environemnt setup for it (e.g. an anaconda environment). This is so that I can keep my project’s dependancies separate from the default dependancies on my system.
First We need to install elastic-apm:
pip install elastic-apm
Currently Django and Flask are supported, but elastic has a Public API which we can use to integrate into our custom Python code.
To Create a python agent, We simply need to run our script with the Python agent initialisation code:
from elasticapm import Client

client = Client(service_name="test")

if __name__ == "__main__":
    client.capture_message('Test Message')
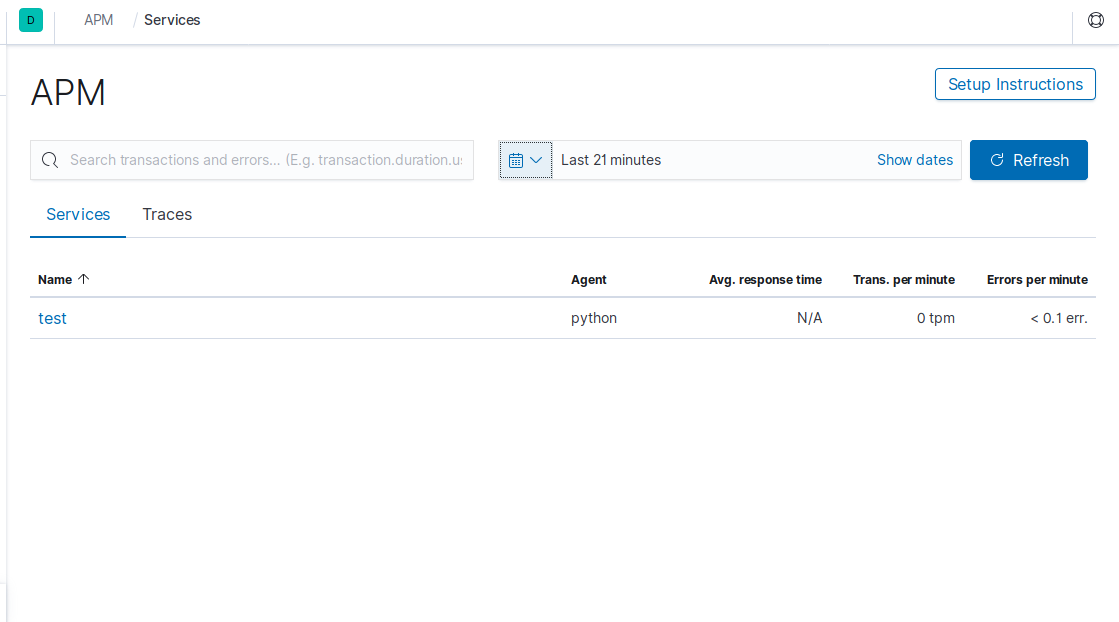
After this, go to Kibana and you should see your python agent (called “test”) in the APM dashboard
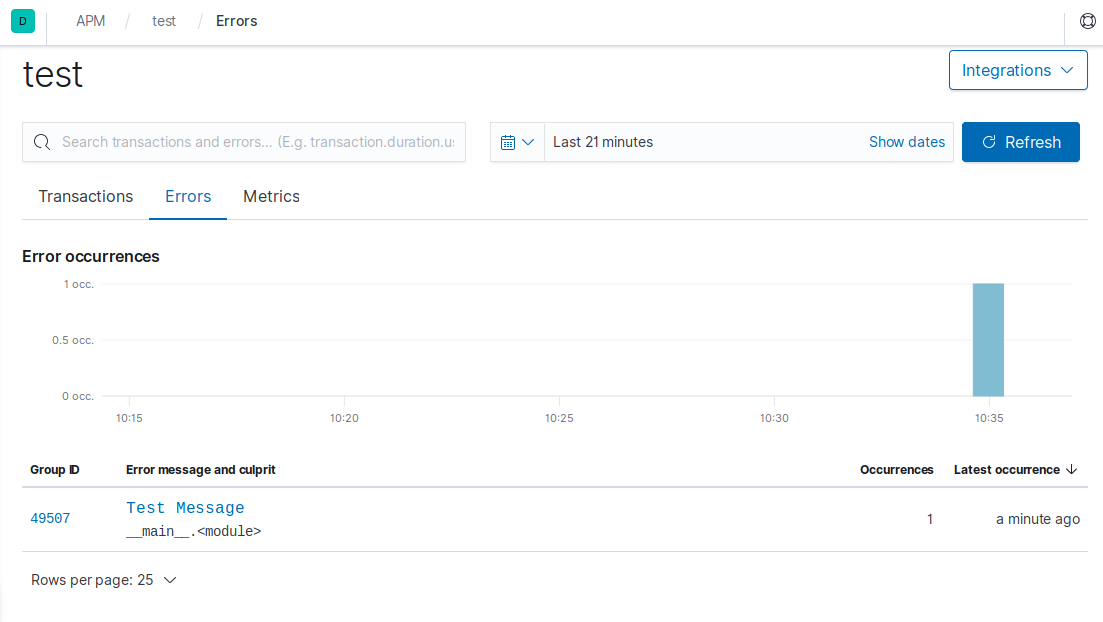
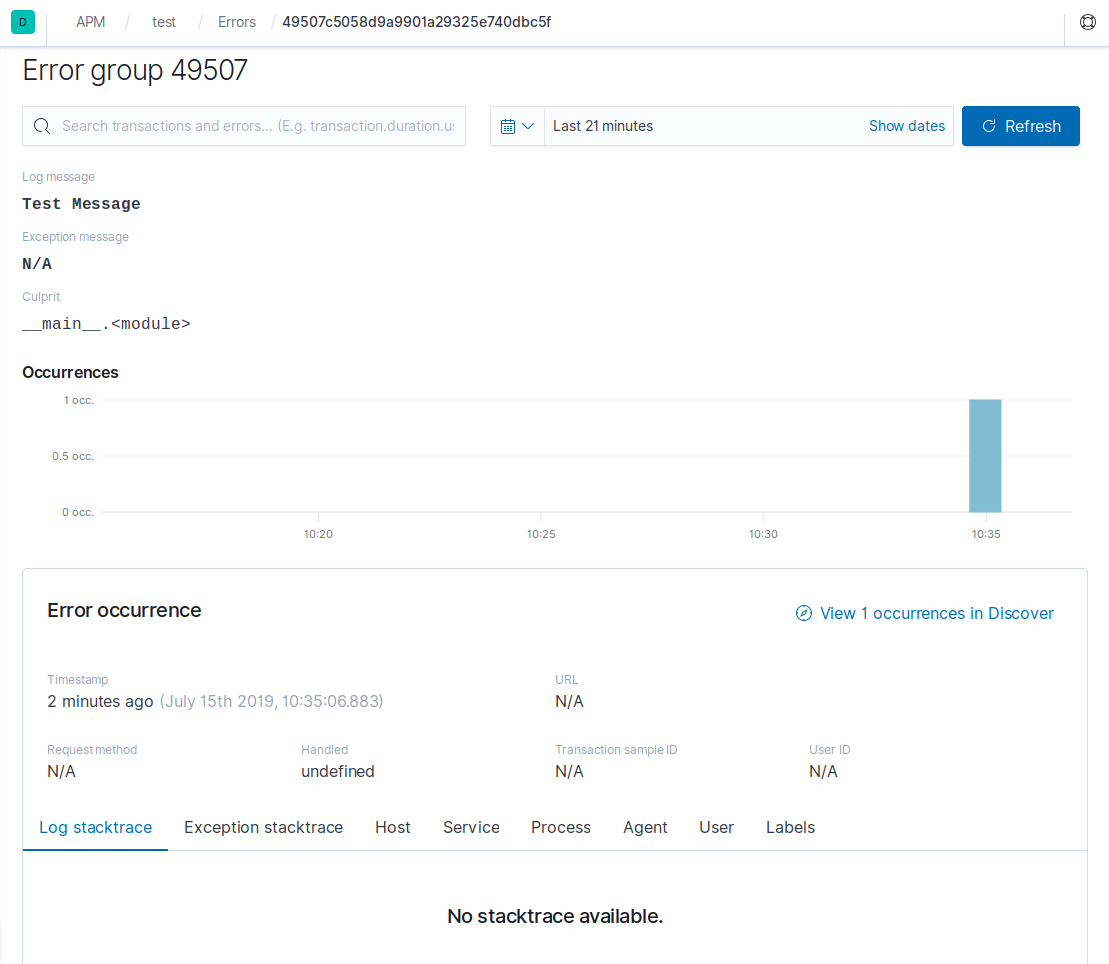
You can see the log message:
Configure the Python Agent for storing custom fields
With the last section we learn how to “log” a message into APM.
With the capture_message() function, you can simply send a log to APM. Note that the “logs” will be found in the error section of APM. Note that you can also use the capture_exception() function when an exception occurs - This will capture the exeception stack trace and in Kibana APM, you will see the exact line of code the error occured. How useful is that?.
Sometimes, we want to add more data to our log e.g to gain more insight to what error occured. If we wan’t to add custom fields to logs, we simply add a dictionary of the custom fields that we wan’t to log to the capture_message() function
from elasticapm import Client

client = Client(service_name="test")

if __name__ == "__main__":
    data = {
        'name': 'Joe Bloggs'
    }

    client.capture_message('Test Message', custom=data)
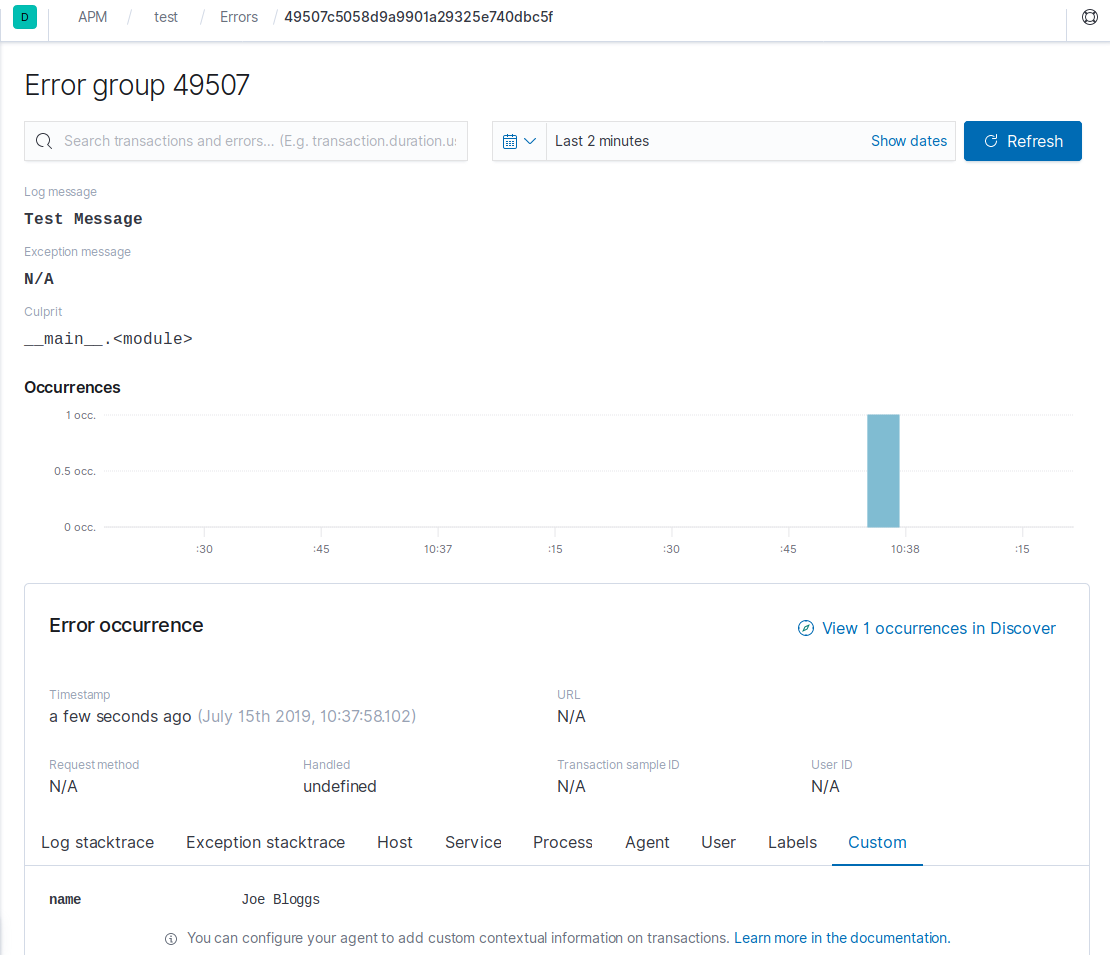
You can see the “custom_field”:
Transactions and Spans
In the last example we look at the capture_message() function to send logs/messages to APM. With Transactions and spans, you can track your functions and gain performance insight on your functions performance and execution.
In the example below, we begin the transaction, delay 4 seconds, run do_thing() function (notice that this will be captured via a span), delay for 4 seconds, end transaction and then capture the “Test Log Message”.
from elasticapm import Client

client = Client(service_name="test")

@elasticapm.capture_span()
def do_thing():
    sleep(5)

if __name__ == "__main__":
    data = {
        "custom_field": "test_value"
    }

    client.begin_transaction(transaction_type="track-do-thing")

    sleep(4)
    do_thing()
    sleep(4)

    client.end_transaction("finish-do-thing", "success")

    client.capture_message(message="Test Log Message", custom=data)
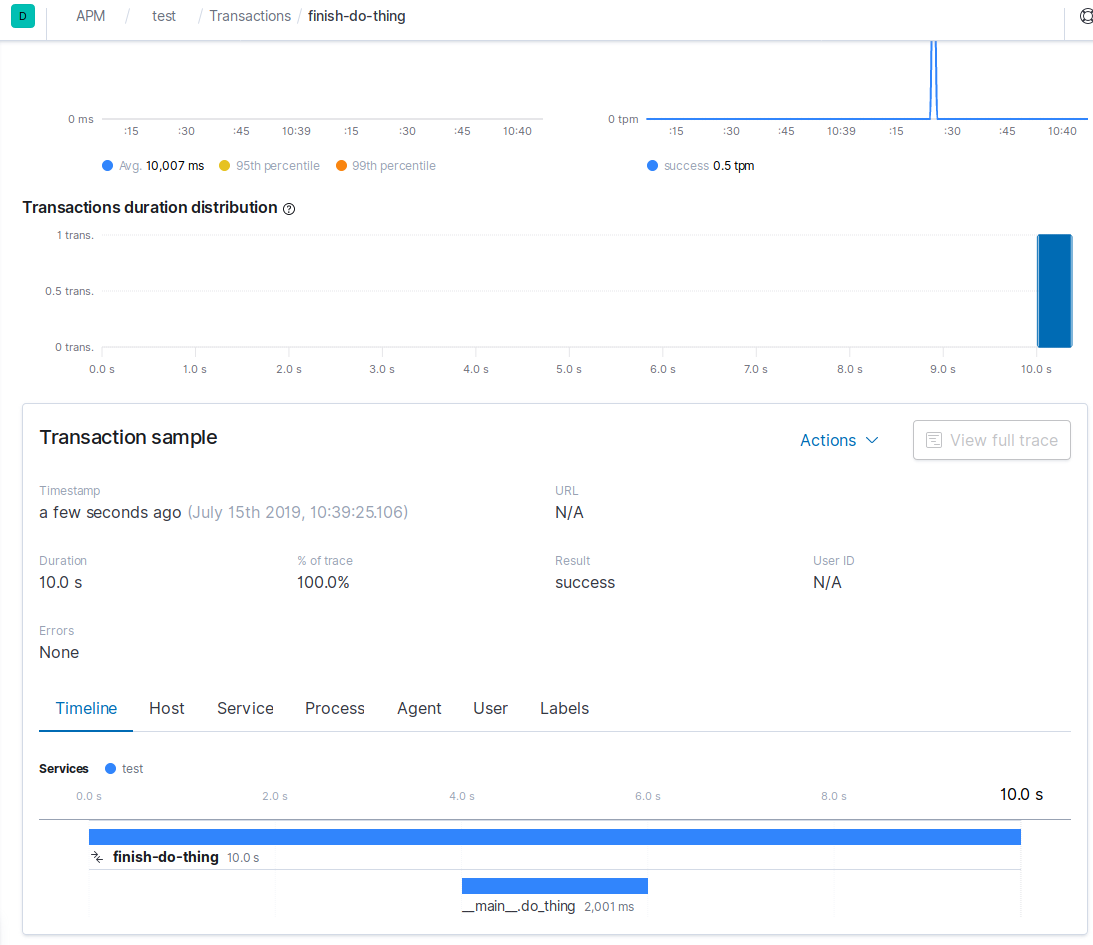
Now when you look at the APM Dashboard on Kibana, you will see your transaction. You will also see the transaction timeline - You will the span of time that the main function ran and the do_thing() function ran for:
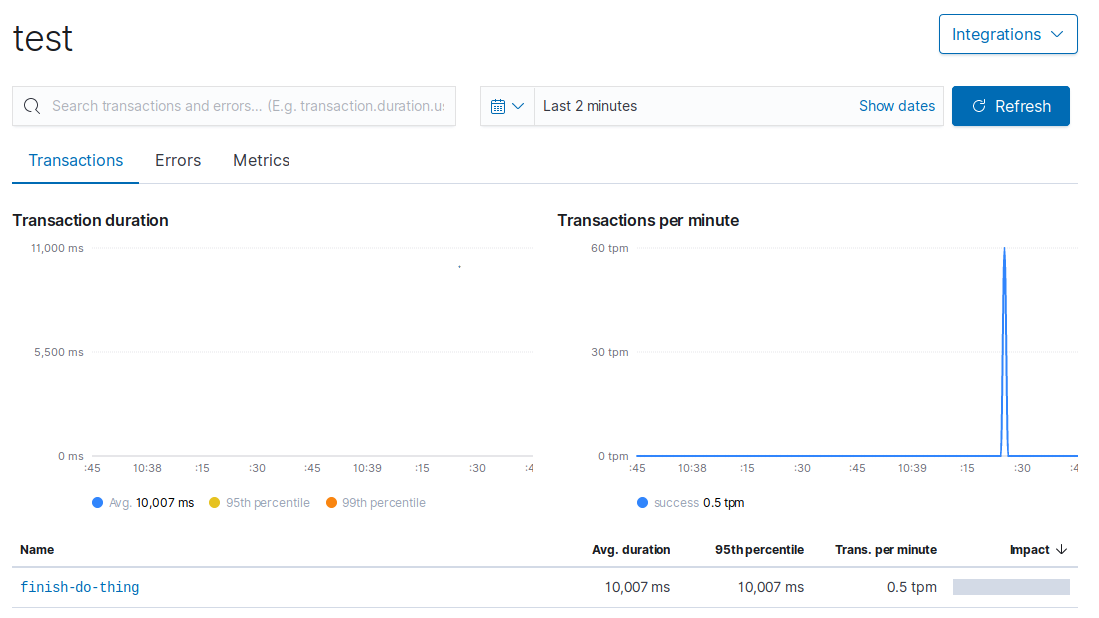
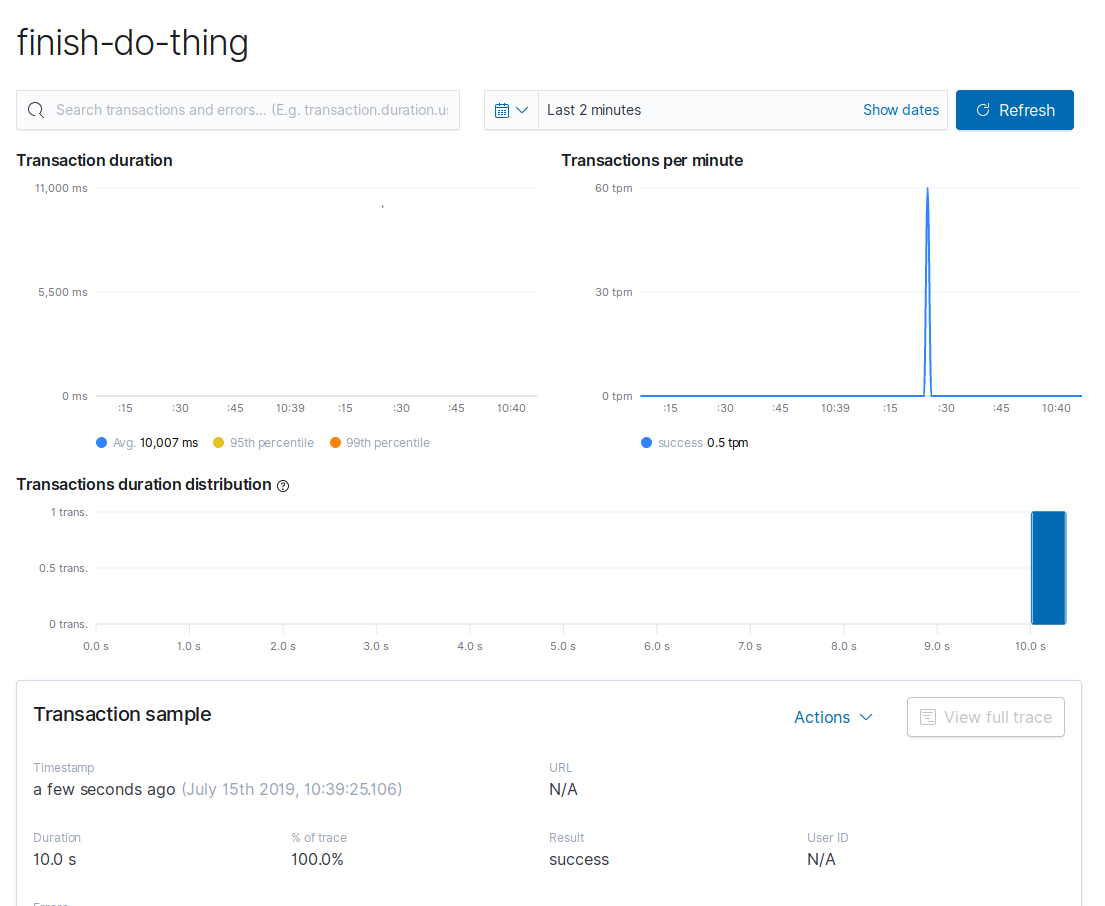
You can see a timeline of the functions’ exxecution:
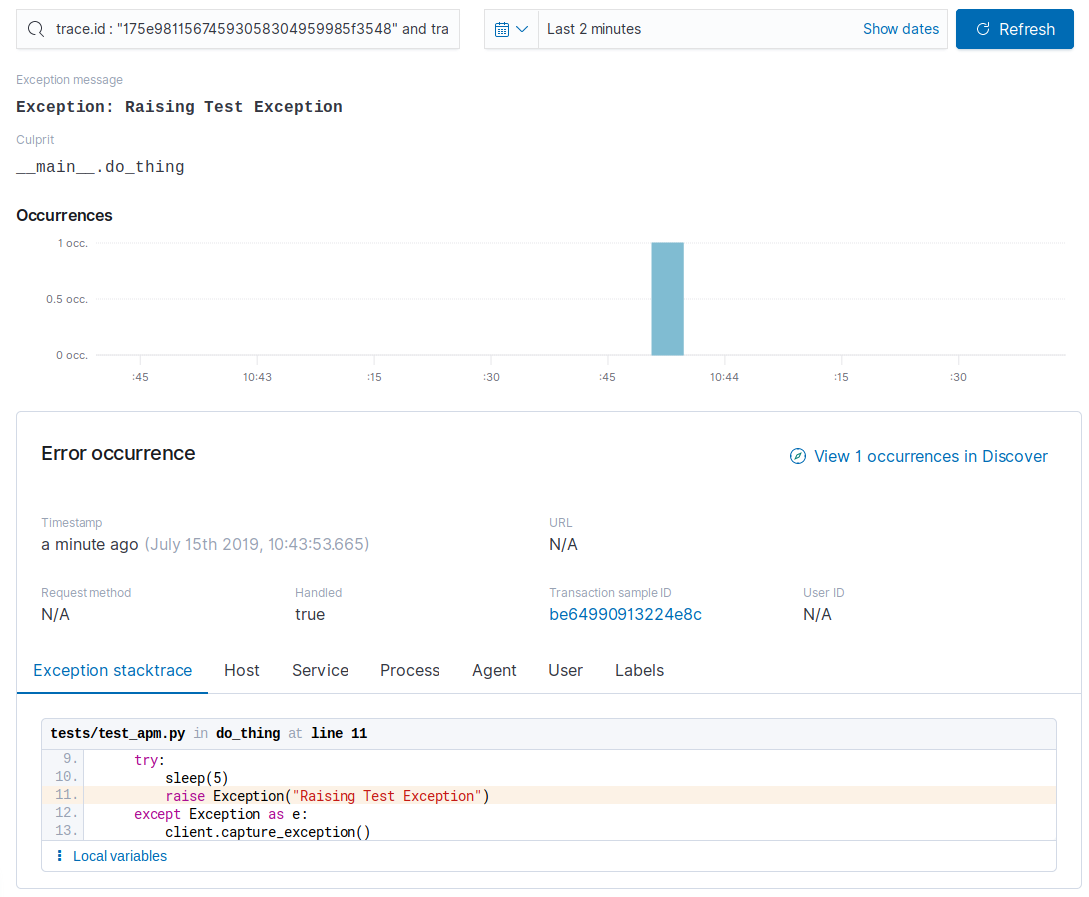
Using capture_exception()
When you use the capture_exception() function at an Exception part of the code, apm logs the Exeception stack trace and allows to pinpoint where in the code the error occured. In the example below, we raise an exception in the do_thing() function
from elasticapm import Client

client = Client(service_name="test")

@elasticapm.capture_span()
def do_thing():
    try:
        sleep(5)
        raise Exception("Raising Test Exception")
    except Exception as e:
        client.capture_exception()

if __name__ == "__main__":
    data = {
        "custom_field": "test_value"
    }

    client.begin_transaction(transaction_type="track-do-thing")

    sleep(4)
    do_thing()
    sleep(4)

    client.end_transaction("finish-do-thing", "success")

    client.capture_message(message="Test Log Message", custom=data)
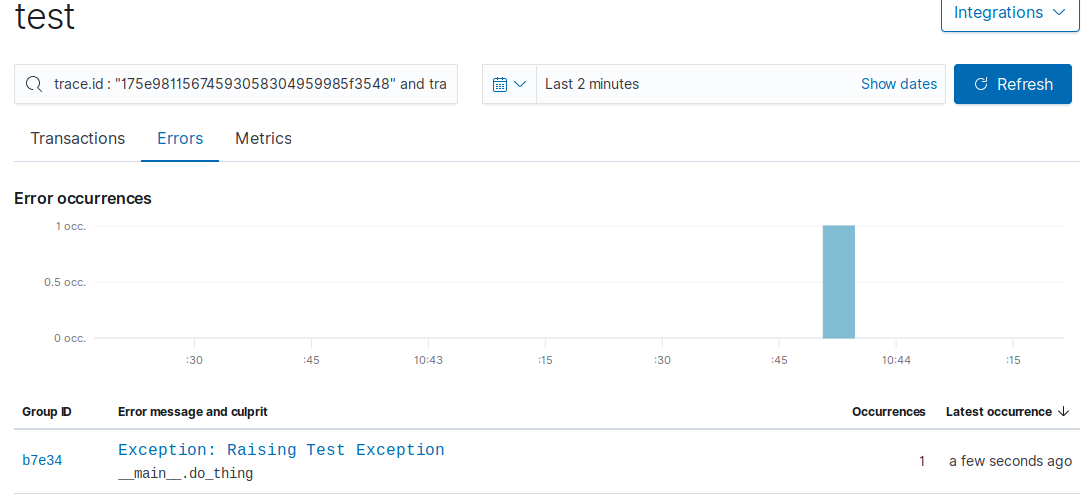
You can see which part of the code cause the exception:
Conclusion
By the end of this post, I hope that you’ve:
- Leared how you can add your custom Python code as an agent for apm
- Gained insight into your python code’s performance
As always, Thanks for reading.
John